Word cloud
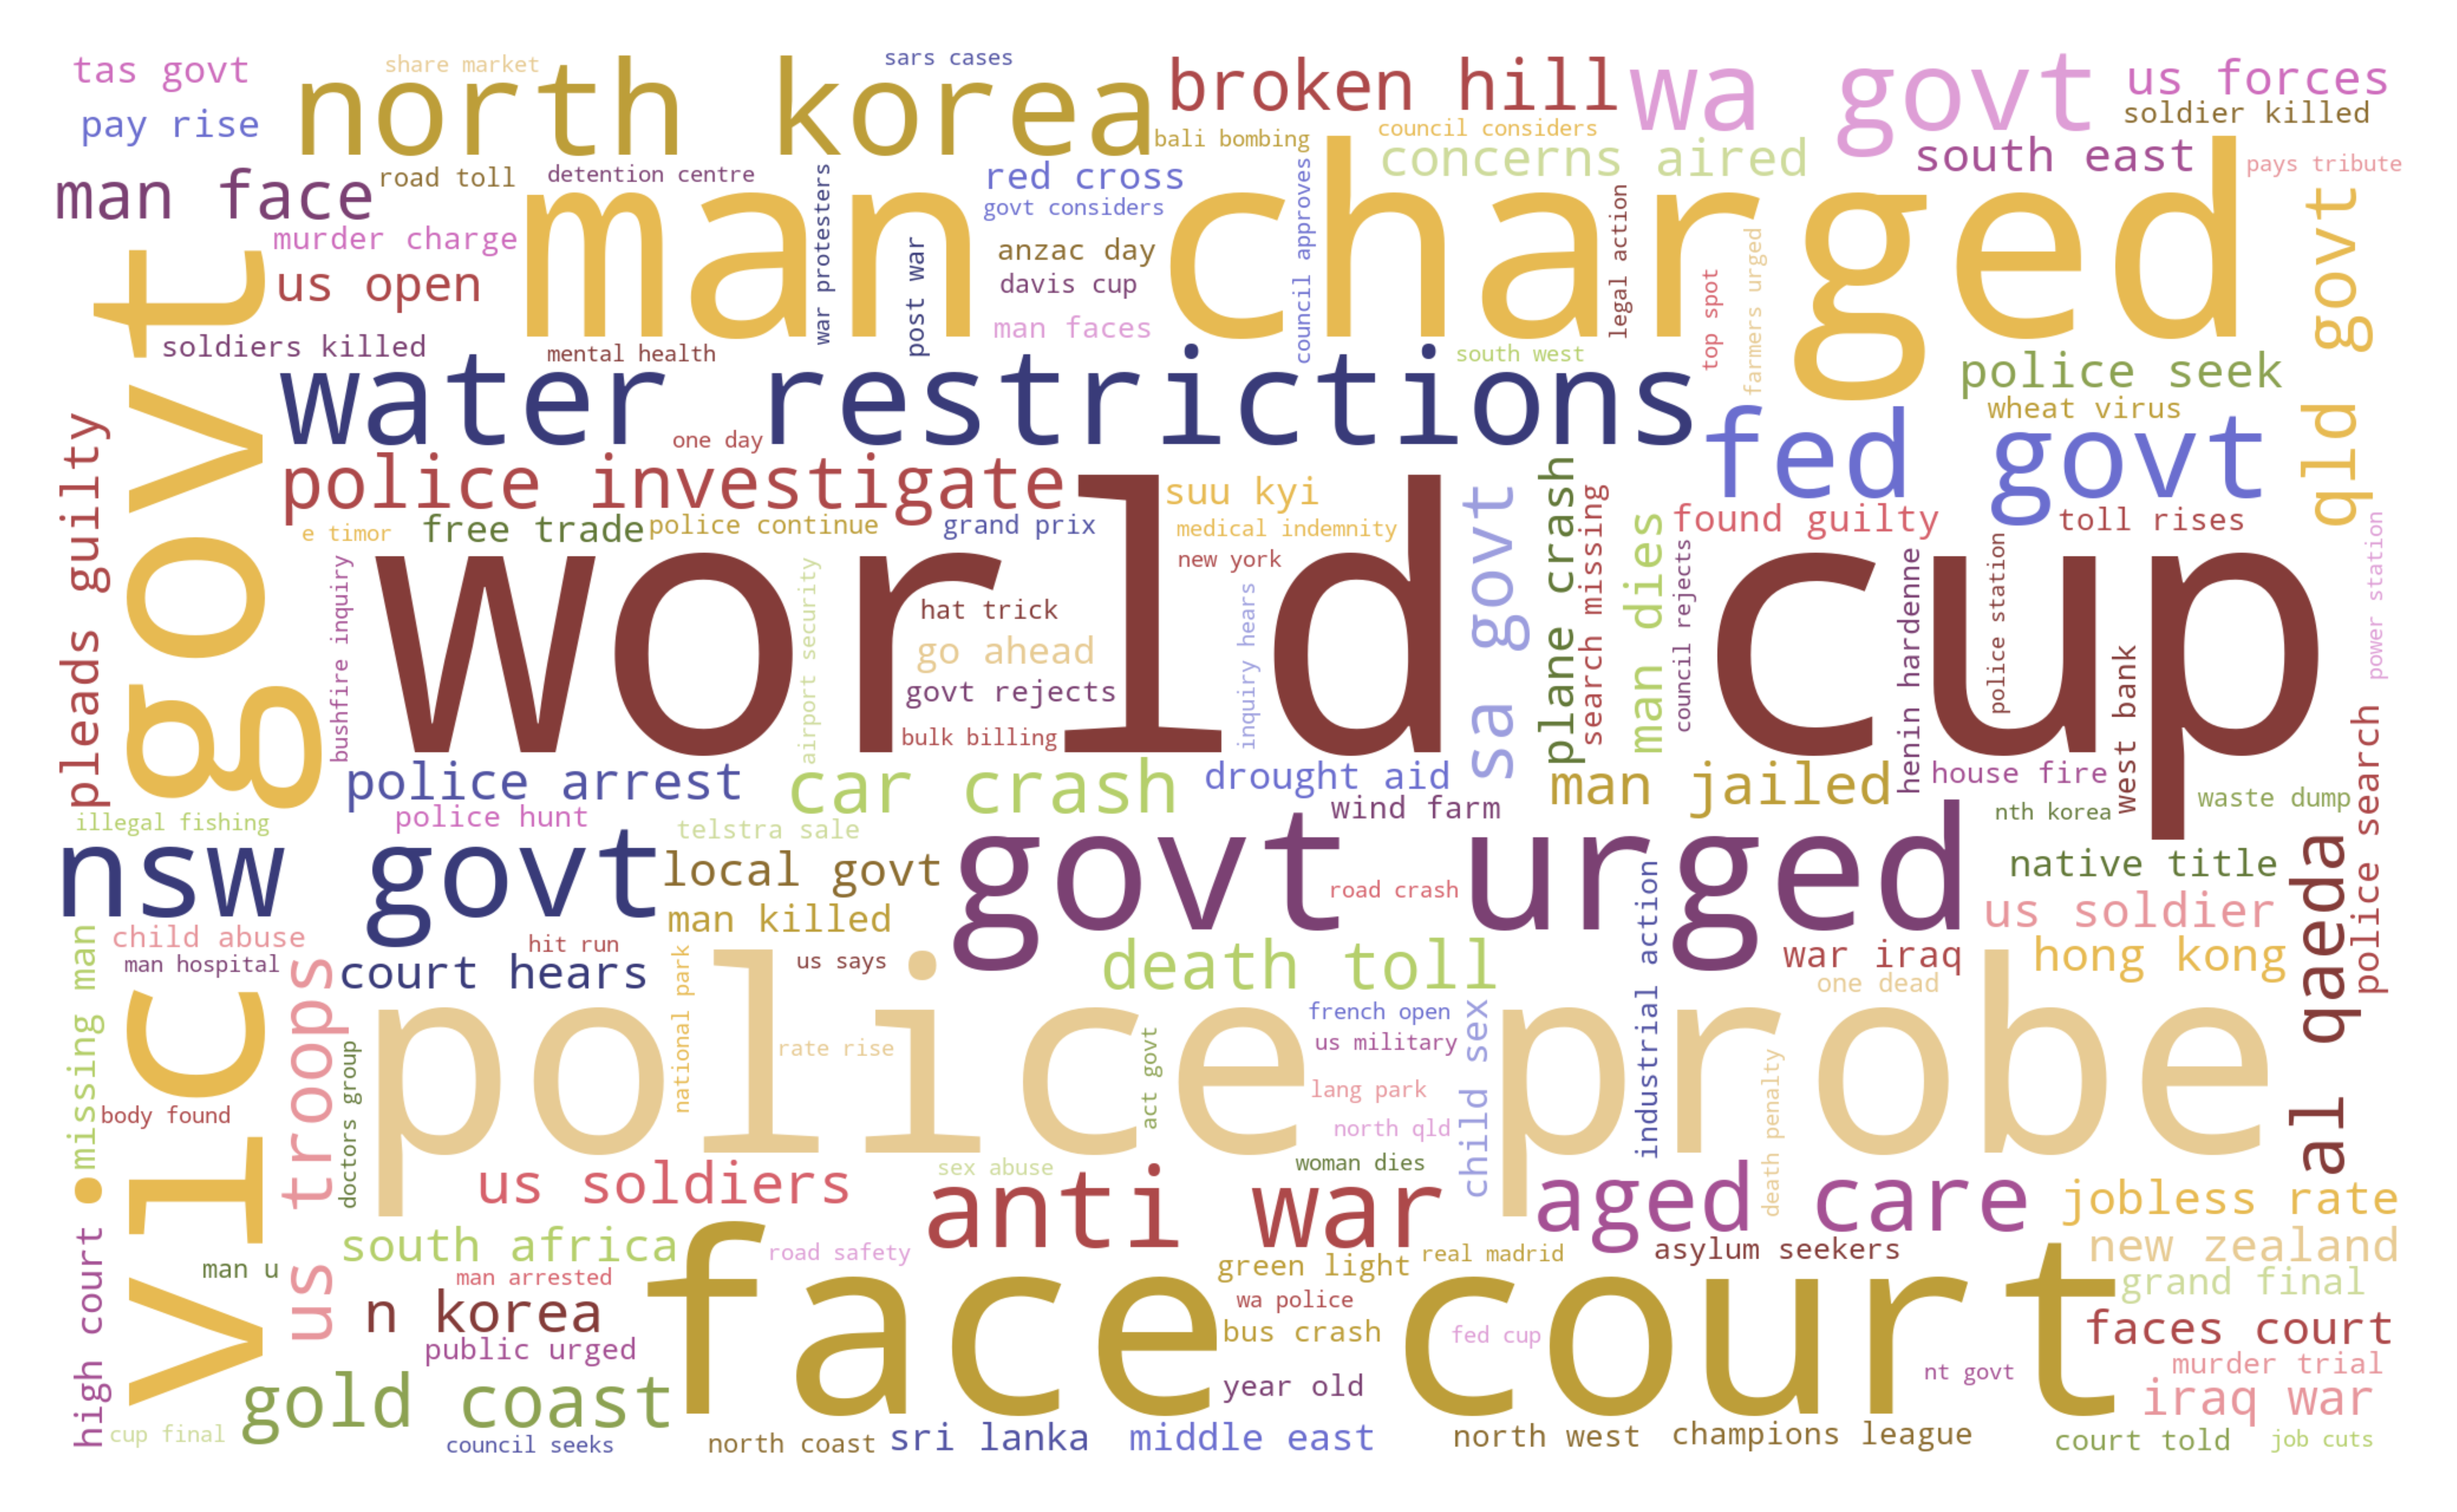
Word cloud is a visual representation of n-grams that give greater importance to words that appear more frequently in a source text. The bigger and bolder the n-gram appears, the more frequently it appears in the text.
Graph display unigrams (single words), bigrams, and trigrams for the source text.
Coding example:
Use case: Essential topics in newspaper headlines
Data: Million News Headlines dataset, source: Australian Broadcasting Corporation, data licence: CC0 1.0: Public Domain.
Coding:
1import pandas as pd
2from arabica import cappuccino
1 data = pd.read_csv('abcnews_data.csv', encoding='utf8')
The data looks liks this:
headline |
date |
|---|---|
aba decides against community broadcasting licence |
2003-2-19 |
act fire witnesses must be aware of defamation |
2003-2-19 |
It procceeds in this way:
additional strings cleaning, if
skip is not Nonelowercasing: reviews are made lowercase so that capital letters don’t affect n-gram calculations (e.g., “Tree” is not treated differently from “tree”), if
lower_case = Truepunctuation cleaning - performs automatically
stop words removal, if
stopwords is not Noneextended stop words removal, if
stopwords_extened is not Nonedigits removal, , if
numbers = Truen-gram frequencies for each headline are calculated, summed, and displayed in a word cloud.
 1cappuccino(text = data['headline'],
 2           time = data['date'],
 3           date_format = 'us',                 # Uses US-style date format to parse dates
 4           plot = 'wordcloud',
 5           ngram = 2,                          # N-gram size, 1 = unigram, 2 = bigram, 3 = trigram
 6           time_freq = 'ungroup',              # No period aggregation
 7           max_words = 150,                    # Displays 150 most frequent bigrams
 8           stopwords = ['english'],            # Remove English stopwords
 9           stopwords_ext = ['english'],        # Remove extended list of English stopwords
10           skip = ['<br />'],                  # Remove additional strings. Cuts the characters out without tokenization, useful for specific or rare characters. Be careful not to bias the dataset.
11           numbers = True,                     # Remove numbers
12           lower_case = True)                  # Lowercase text
Here is the output:
Download the jupyter notebook with the code and the data here.