Structural break analysis
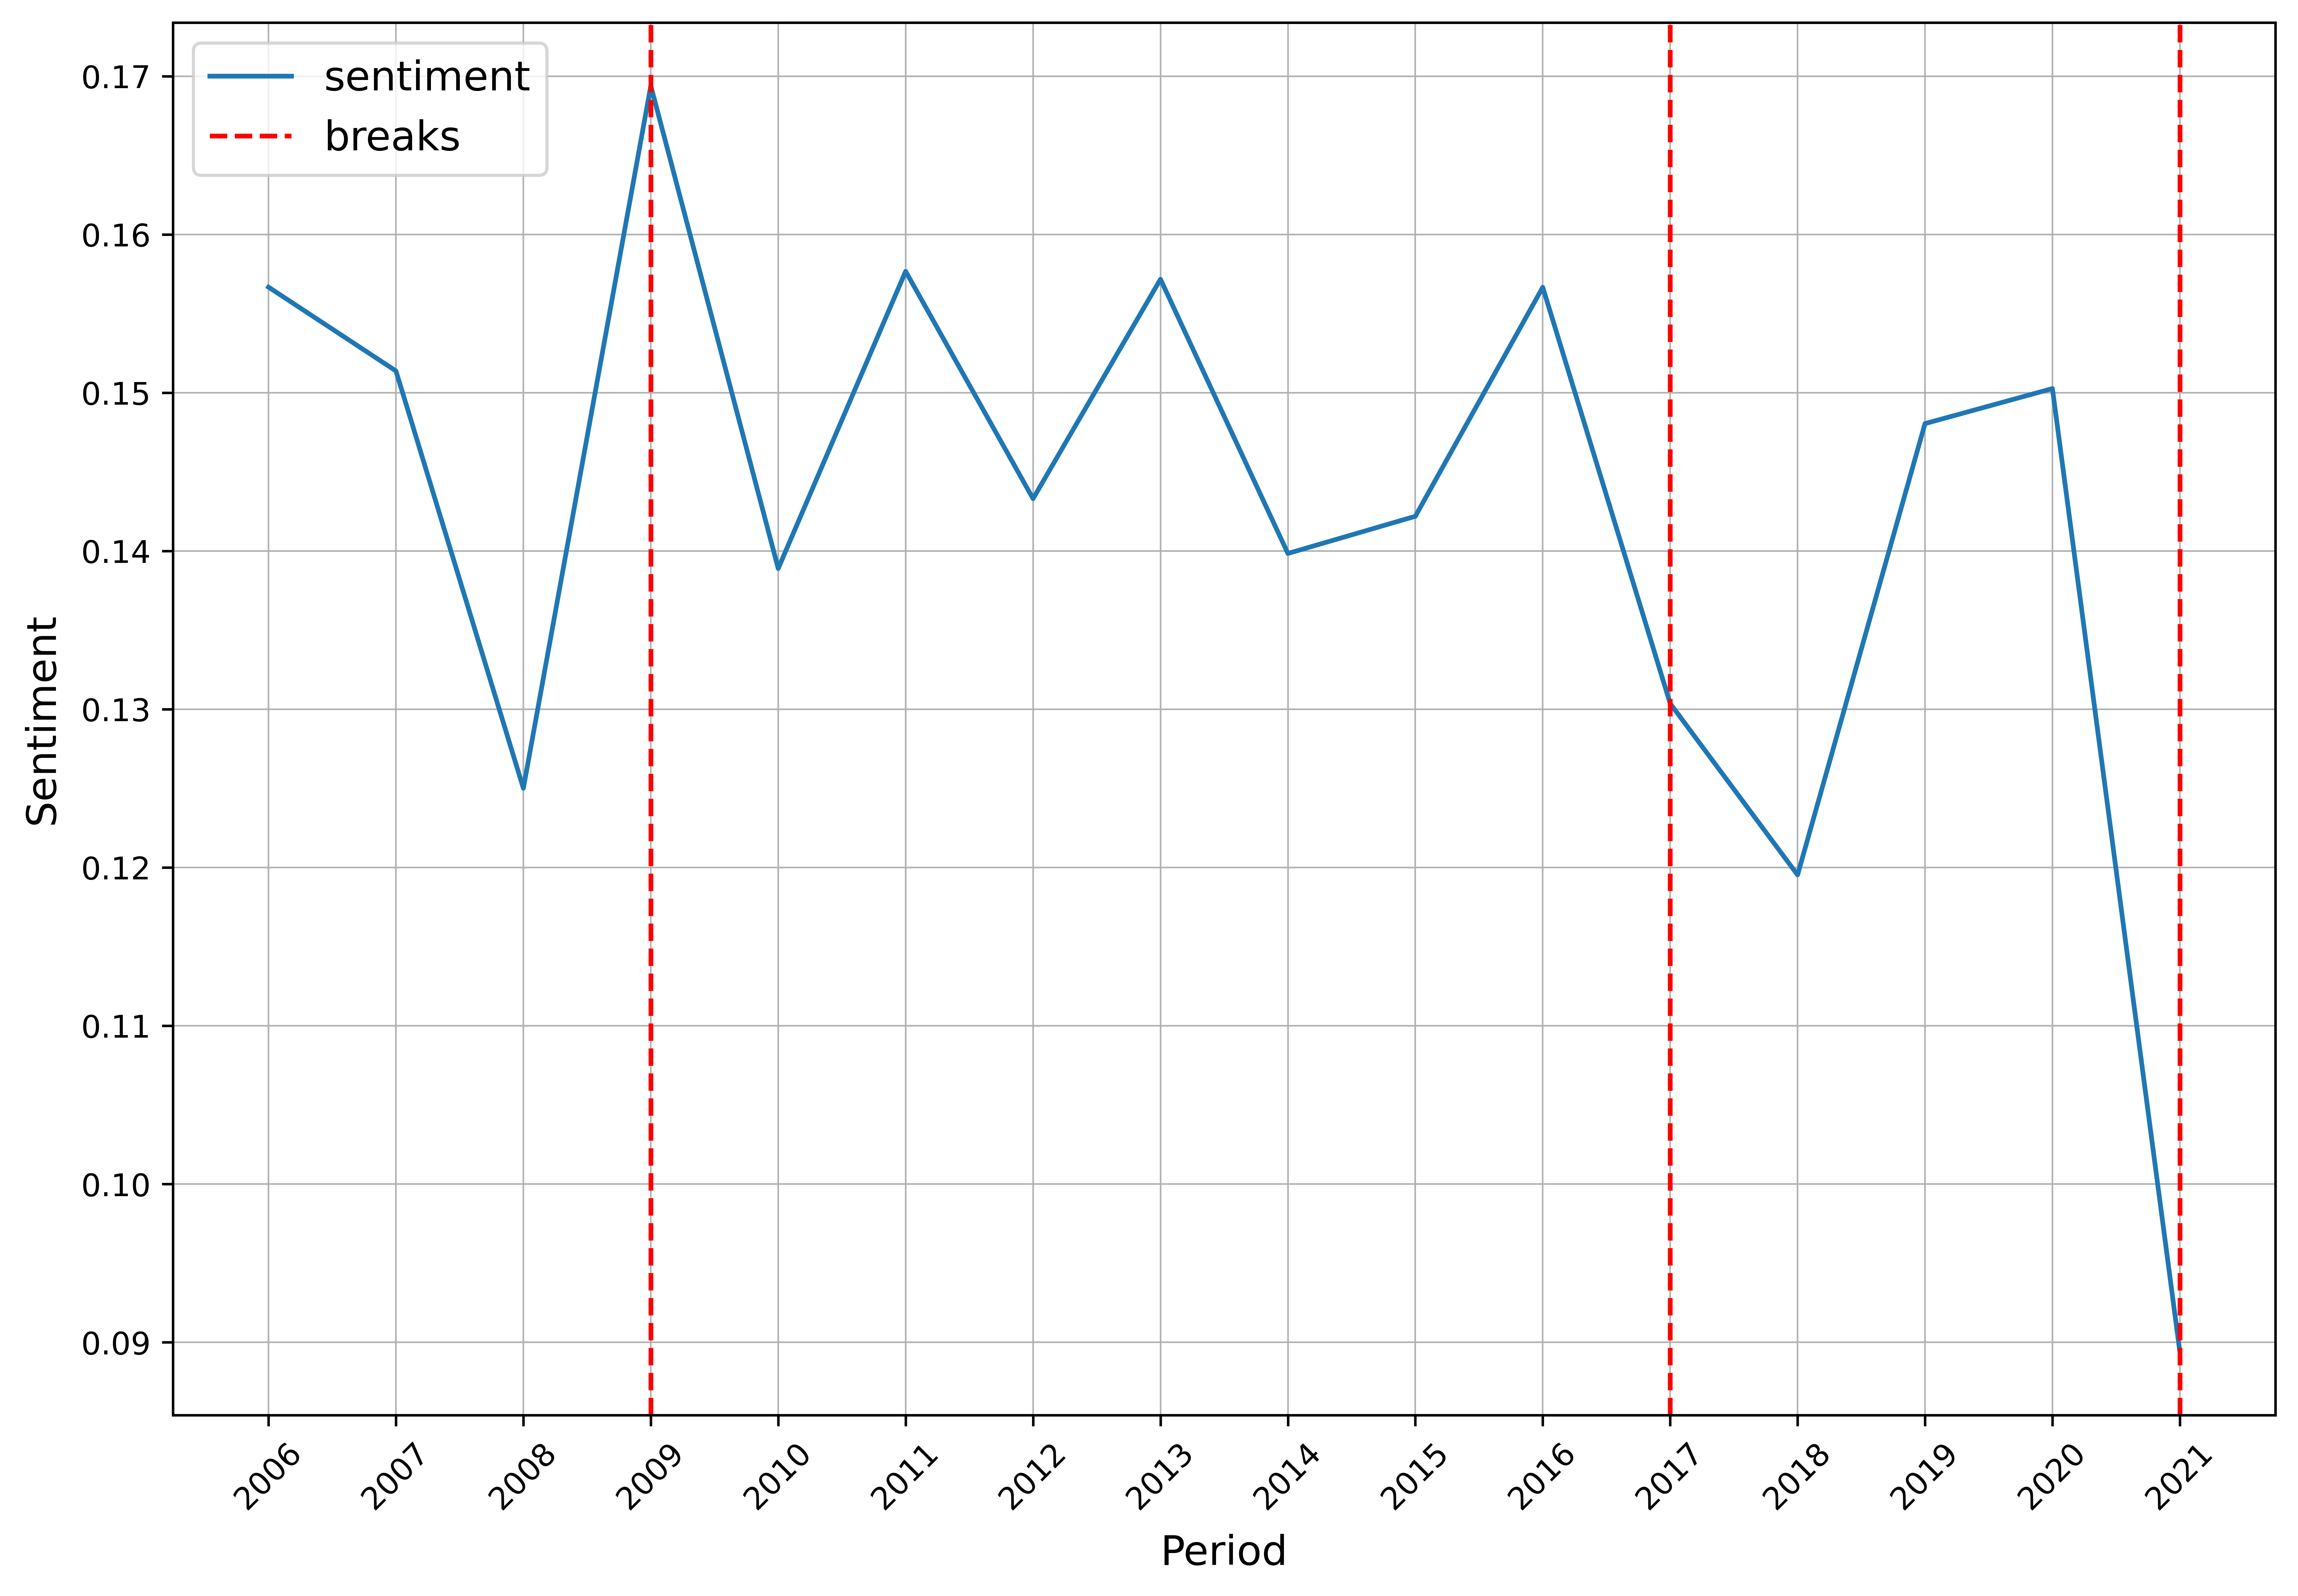
coffee_break takes text data as the input, enables digits and punctuation cleaning, and provides time-series sentiment analysis with a pre-trained sentiment classifier. It calculates sentiment in each row of the dataset, aggregates it over a specified period, and returns a plot and a dataframe with a corresponding time series.
The implemented models are:
VADER is a lexicon and rule-based sentiment classifier attuned explicitly to sentiments expressed in social media. It works best with general-language texts
FinVADER improves VADER’s classification accuracy, including two financial lexicons. It should be applied to texts in the financial and economic domain
Break points are identified with Fisher-Jenks algorithm. The method was originally published in George Jenks’ (1977) Optimal Data Classification for Choropleth Maps. The method primarily derived from Walter Fisher’s On grouping for maximum homogeneity (1958) has become a popular statistical method of breakpoint analysis since then.
Coding example
Use case: Sentiment analysis of Twitter tweets about Pfizer & BioNTech vaccine
Data: Pfizer Vaccine Tweets dataset, period: 15/07/2006: 18/11/2021, source: Twitter API, data licence: CC0: Public Domain.
1import pandas as pd
2from arabica import coffee_break
1 data = pd.read_csv('vaccination_tweets.csv',encoding='utf8')
The data looks like this:
text |
date |
|---|---|
Same folks said daikon paste could treat a cytokine storm #PfizerBioNTech https://t.co/xeHhIMg1kF |
20/12/2020 06:06 |
While the world has been on the wrong side of history this year, hopefully, the biggest vaccination effort we’ve ev… https://t.co/dlCHrZjkhm |
13/12/2020 16:27 |
#coronavirus #SputnikV #AstraZeneca #PfizerBioNTech #Moderna #Covid_19 Russian vaccine is created to last 2-4 years… https://t.co/ieYlCKBr8P |
12/12/2020 20:33 |
1 coffee_break(text = data['text'],
2              time = data['date'],
3              date_format = 'eur',      # Read dates in European format
4              model = 'vader',          # Use VADER classifier
5              time_freq = 'Y',          # Yearly aggregation
6              preprocess = True,        # Clean data - punctuation + numbers
7              skip = ["brrrr",
8                      "donald trump"],  # Remove additional stop words
9              n_breaks = 3)             # 3 breakpoints identified
It proceeds in this way:
pre-processing: tweets are cleaned from numbers, punctuation, blank rows and a list of additional stopwords (“brrrr”, “donald trump”)
sentiment classification: sentiment in each row is classified with VADER sentiment classifier. The aggregate sentiment ranges between -1 (most extreme negative) and 1 (most extreme positive). Arabica uses VADER’s compound indicator for sentiment classification (FinVADER as well).
period aggregation: sentiment is aggregated for a specified frequency (year or month), as follows: aggregate sentiment = \(\frac { sum(sentiment)_{t} } { count(rows)_{t}}\), where t is the aggregation period.
breakpoint identification: Fisher-Jenks algorithm identifies breakpoints in the aggregated time series of sentiment
visualization: time series and breakpoints are displayed in a line plot
Here is the output:

At the same time, Arabica returns a dataframe with the corresponding data. The table can be saved simply by:
 1# generate a dataframe
 2df = coffee_break(text = data['text'],
 3                  time = data['date'],
 4                  date_format = 'eur',      # Read dates in European format
 5                  model = 'vader',          # Use VADER classifier
 6                  time_freq = 'Y',          # Yearly aggregation
 7                  preprocess = True,        # Clean data - punctuation + numbers
 8                  skip = ["brrrr",
 9                          "donald trump"],  # Remove additional stop words
10                  n_breaks = 3)             # 3 breakpoints identified
11
12# save is as a csv
13df.to_csv('sentiment_data.csv')
Structural break analysis statistically confirmed what we can see from the time series of sentiment. Fisher-Jenks algorithm identified three structural breaks in 2009, 2017, and 2021. We can only guess what caused the decline in 2009 and between 2016 and 2018. The 2021’s drop is likely caused by the Covid-19 crisis.
Download the jupyter notebook with the code and the data here.